Table of Contents
Assignment and Question Statistics
Assignment Statistics
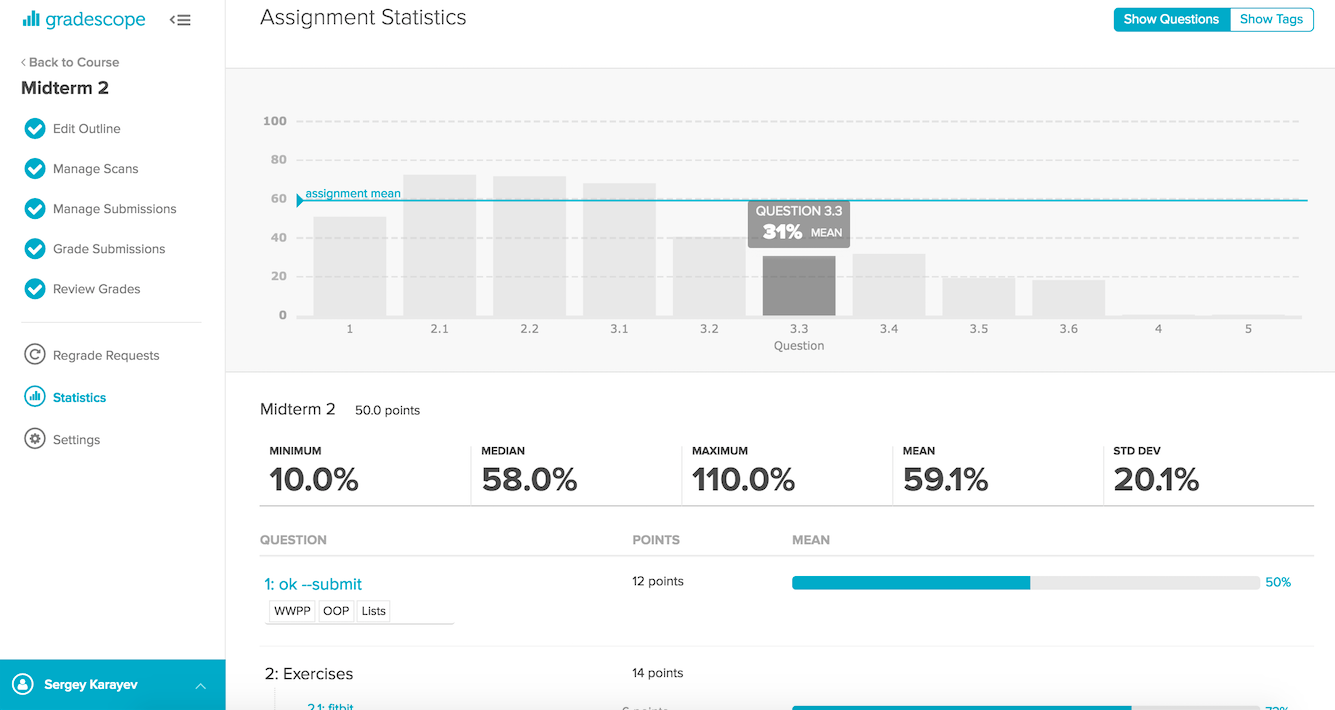
The Statistics page allows instructors to gain further insights into what their students have learned. Only students with uploaded submissions will be counted towards the assignment statistics.
The default view showcases the averages from each question. Clicking a question’s bar within the chart will focus on it, updating the stats under the chart.
Adding and Deleting tags
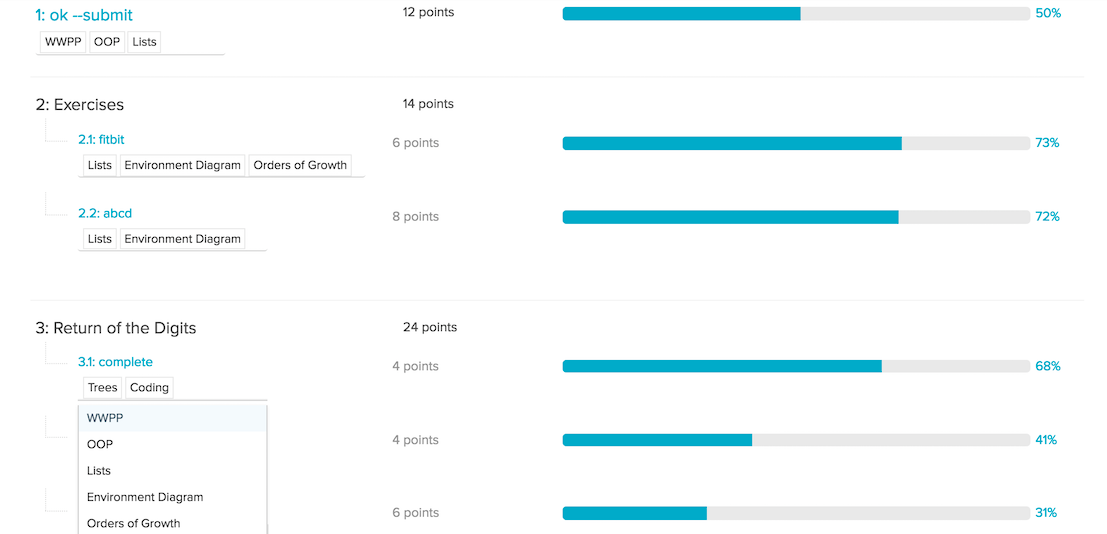
Adding tags to your assignment's questions allows you to track student performance and progress on particular course concepts.
- On the Assignment Statistics page, make sure the Show Questions tab is selected.
- To assign a tag to a specific question, locate the question and select Click to Add Tags.
- Enter in a tag name, and press enter or select Add… to add the tag.
- After you've created and assigned tags to a question, select the Show Tags tab to view the statistical breakdown by percentage of the tag for each question.
- To remove a tag, go to the Show Questions tab and highlight the tag and then press delete on your keyboard.
Viewing Tags
By selecting Show Tags, you can then switch into Tag View to see the breakdown of points by tag. Delete any tag by clicking on the line next to the tag and clicking backspace/delete on your keyboard.
Question Statistics
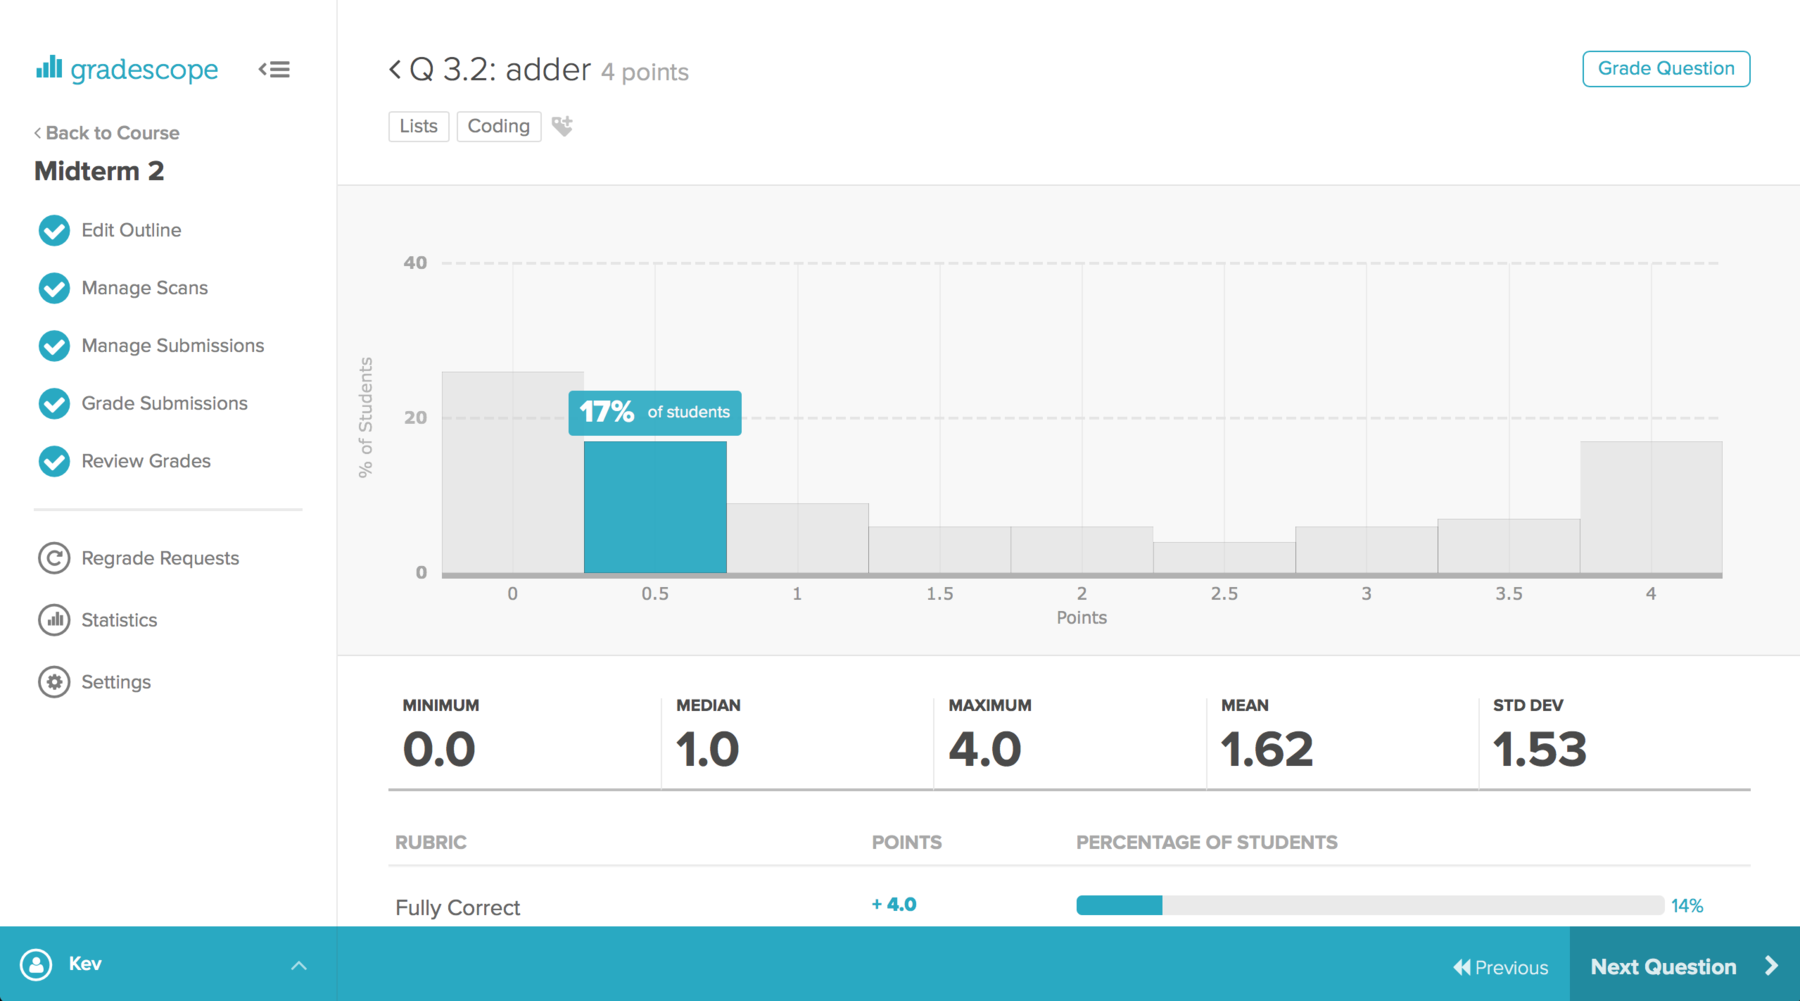
If you click a question in the table below the chart, you can see that question’s statistics, showing you how often each rubric item was applied. This allows you to pinpoint particular difficulties or concepts that students struggled with.